At a glance

Where
Laikipia, Kenya
Started from
EarthRanger for wildlife and security; paper forms and spreadsheets everywhere else
Teams
Security, rhino monitoring, fences and patrols, cattle, the mobile clinic, education, community engagement, lodges and the airstrip
Systems joined
EarthRanger, Soilmentor, AgriWebb, BaoTree, ResRequest, wpsWatch, iNaturalist, eBird and Sage
Reports
A daily rhino situation report, a daily fence report and monthly programme reports

Where it started

When we started, Borana used EarthRanger for wildlife and security, and the other departments kept their records on paper and in spreadsheets. We moved each department's forms onto EarthRanger wherever it fitted, so today every department records there, from security and rhinos to the clinic, education and the lodges.

Borana's own database

We built Borana its own cloud database, which gives it data sovereignty over its records and keeps them secure. It holds all of Borana's records and mapping, backfilled with historic data, and every dashboard and report draws from it.

EarthRanger feeds into it, alongside the systems that were already fit for purpose, such as Sage for the accounts and Soilmentor for rangeland monitoring. Because everything ends up in one database, we can run cross-departmental analytics and outcomes-based reporting.

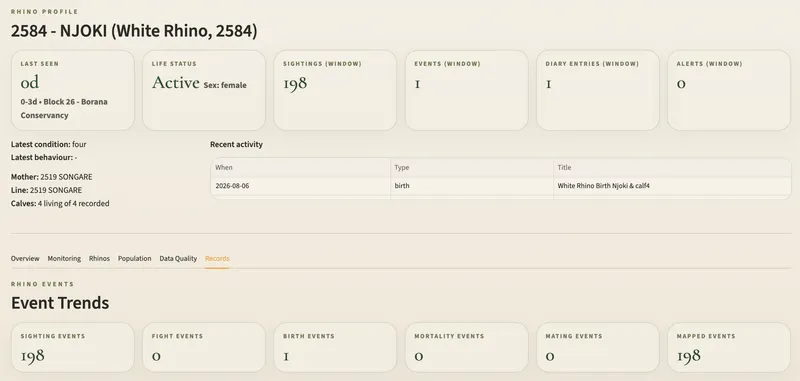
A rhino's profile on the rhino dashboard: when it was last seen, its status and sex, its latest condition, mother, line and calves, its recent activity, and counts of its sightings, births and other events.

Rhinos and security

Every rhino has its own record of sightings, condition and calves, and the dashboard flags any rhino the teams haven't seen within a week. Security, rhino and fence records refresh every half hour, and the rhino situation report is ready each day.
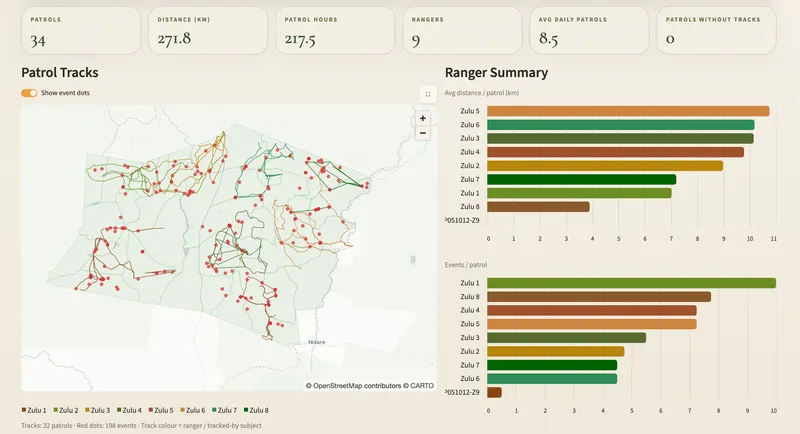
The patrols dashboard: counts of patrols, distance, hours and rangers, a map of recent patrol tracks with red dots where the teams logged what they found, and charts of distance and events per patrol for each team.

Fences and patrols

Fence teams patrol their sections every day. The patrols dashboard checks that each team went out and logged what it found, and the daily fence report lists the breaks and repairs.

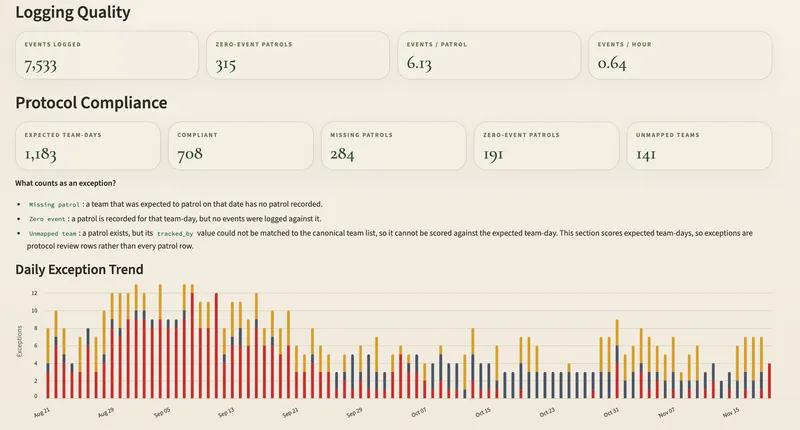
The patrol compliance dashboard: events logged, expected team-days against compliant ones, missing and zero-event patrols, what counts as an exception, and a daily chart of exceptions from late August to November that falls from around ten a day to around five.

Patrol compliance

Each team's expected patrol days are checked against what was recorded, flagging missing patrols, patrols with nothing logged and patrols that can't be matched to a team. Since the checks began in late August, missing patrols have fallen from about seven a day to fewer than one, and exceptions overall have halved.

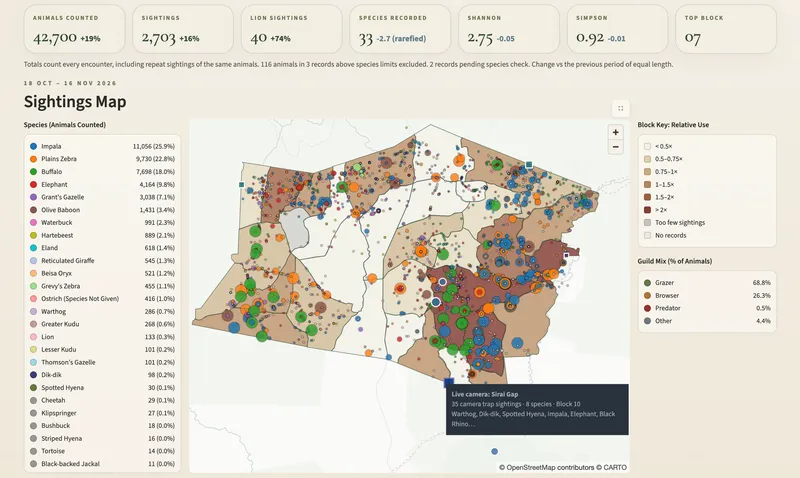
The wildlife sightings dashboard: animals counted, sightings, lion sightings, species recorded and diversity figures, above a list of species, a map of sightings across the conservancy's blocks and a key to how much each block is used.

Wildlife sightings

Rangers' sightings in EarthRanger and the camera traps, live and hand-collected, come together on one map, counted by the same rules.

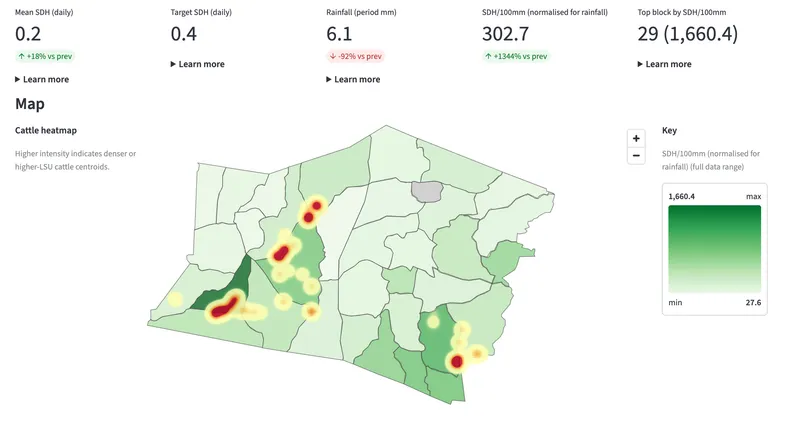
The grazing pressure dashboard: stocking and rainfall figures above a map of the conservancy's grazing blocks, with a heatmap showing where the cattle herds have been.

Grazing pressure

Head counts come from AgriWebb and positions from the cattle collars, joined so each herd is counted on the grazing block it's on. We also allocate livestock units to wildlife and combine them with the cattle, to understand grazing pressure and the land's response across the conservancy. A collar whose movements don't match its herd is flagged for checking.

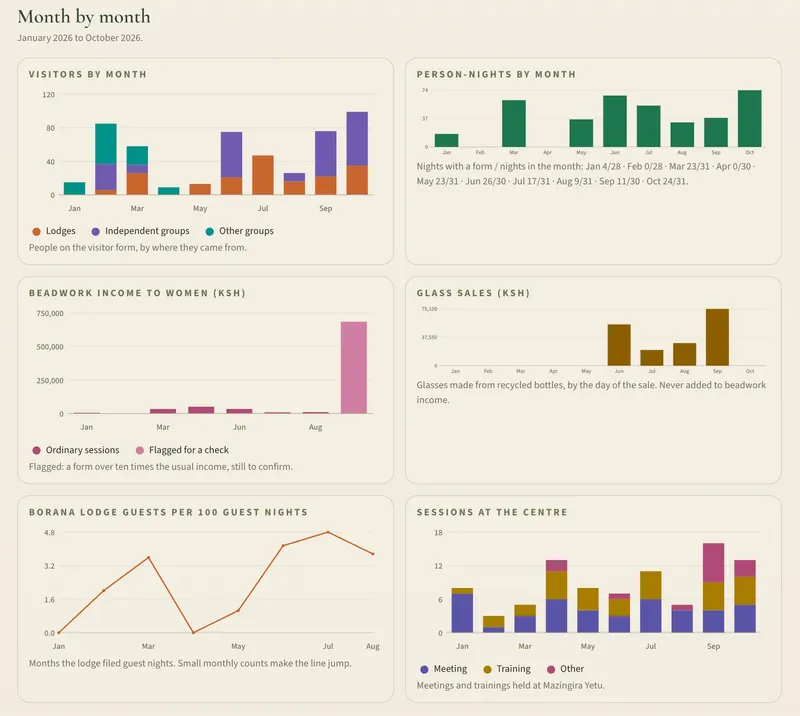
A monthly report from the Mazingira Yetu centre: charts of visitors and person-nights by month, beadwork income, glass sales, lodge guests and sessions held at the centre.

Community programmes

The mobile clinic, the BESP education programme, Mazingira Yetu and community engagement each have a dashboard and a monthly report, small enough to send on WhatsApp.

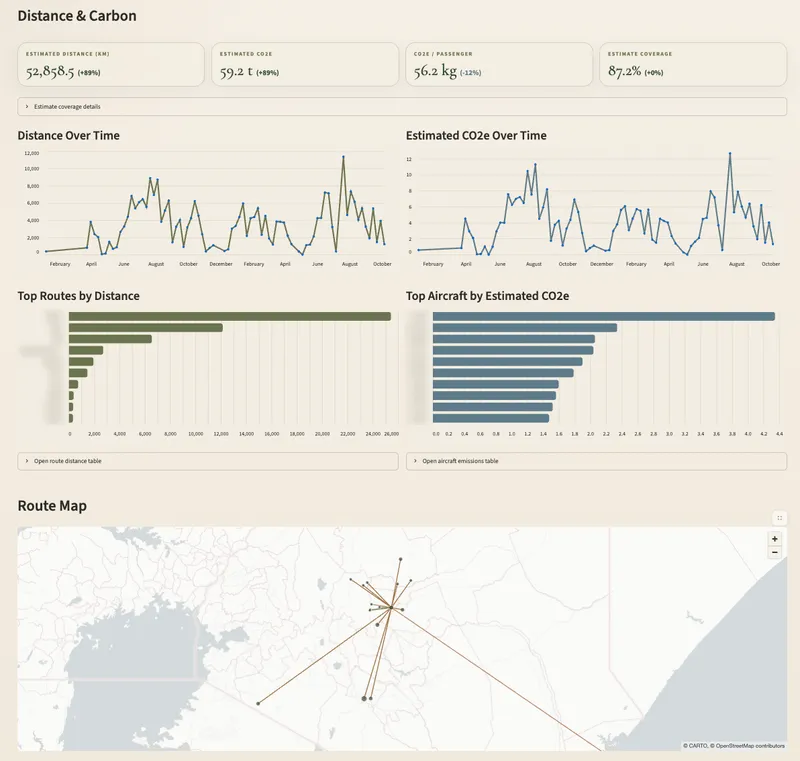
The airstrip's distance and carbon dashboard: estimated distance flown and CO2e, charts of both over time, the top routes and aircraft with their names blurred, and a map of the routes flown.

Lodges and the airstrip

Each lodge's monthly return on fuel, power, water and waste becomes its carbon footprint. Flights at the airstrip are turned into distances and estimated emissions.

Vehicles and fuel

Every refuel is logged in EarthRanger with the litres and the odometer reading. The fuel dashboard works out each vehicle's fuel use per kilometre from one refuel to the next, and flags readings that go backwards, jump too far or give an impossible fuel use.

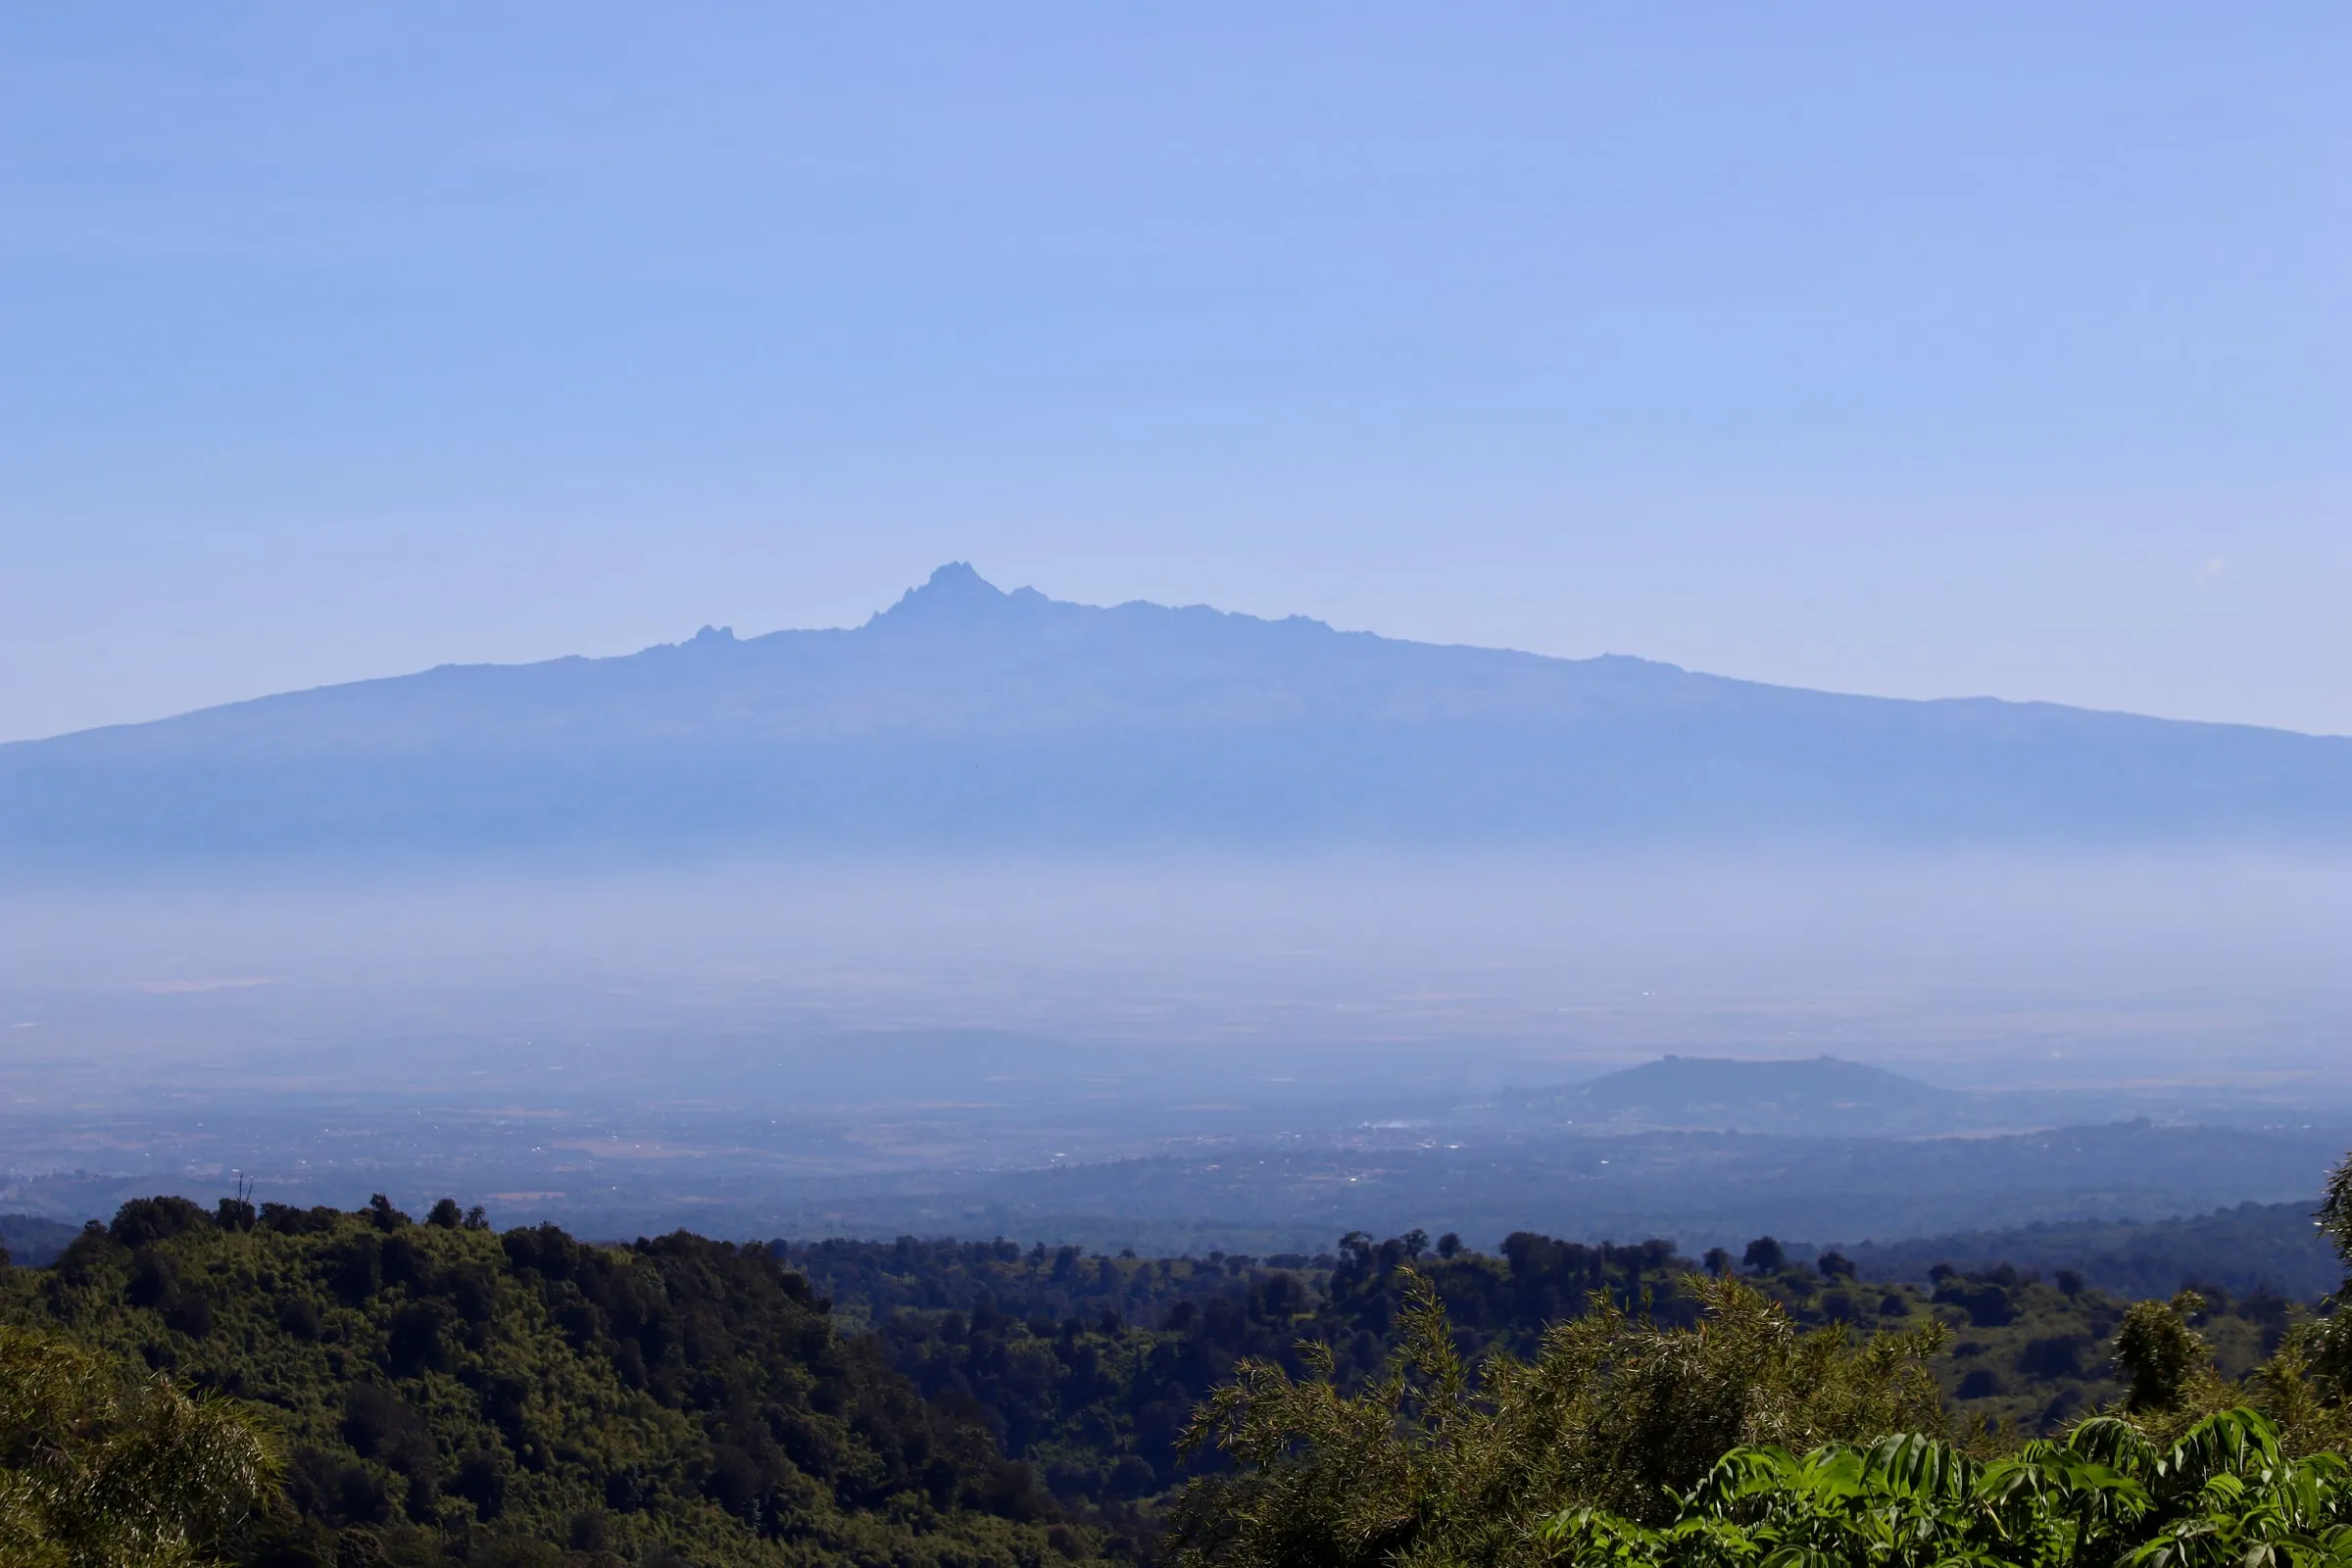
A mountain rises above a hazy valley and forest.

Start with a review.

We look at your systems and records first, then build in stages and keep it running.