Your systems

  • Security and wildlife
  • Accounts
  • Cattle records
  • Bookings
  • Camera traps
  • Citizen science
  • Rangeland monitoring

Joined up

Wild Insight Labs platform

Built on top

  • Live dashboards
  • Automatic reports
  • Alerts

Joining up your systems

We read from the systems an operation already runs on: EarthRanger and SMART for security and wildlife, the accounts, cattle management and bookings, camera traps (including ones whose cards are collected by hand), citizen science apps such as iNaturalist and eBird, rangeland monitoring and community forms. Records are checked as they arrive and held under one shared data model. Teams keep recording the way they do now.


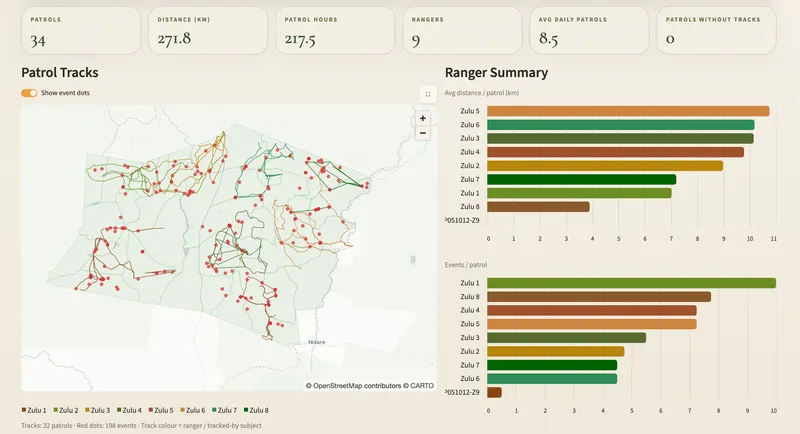
The patrols dashboard: counts of patrols, distance, hours and rangers, a map of recent patrol tracks with red dots where the teams logged what they found, and charts of distance and events per patrol for each team.

Live dashboards

A dashboard for each programme: security, rhino monitoring, patrols, wildlife, conflict, vehicles and fuel, grazing, community and tourism. They update through the day and show how things are trending; the security dashboard, for example, shows the days since the last incident for each type of threat. Urgent events are sent to the right person by email, text or WhatsApp.

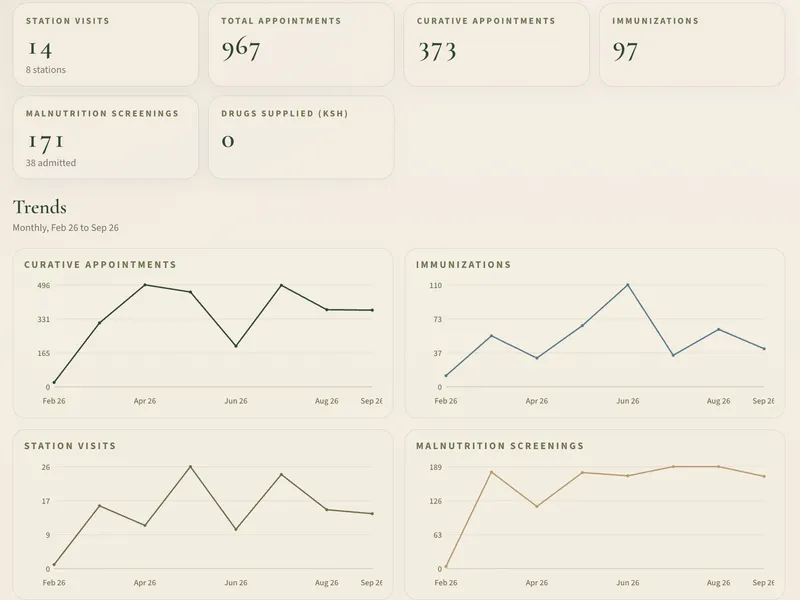
A page from a monthly mobile clinic report: station visits, appointments, immunisations and malnutrition screenings, with a trend chart for each.

Automatic reports

The reports boards, donors and partners ask for, made from the same records as the dashboards: a daily rhino situation report, a daily fence report and monthly programme reports. They can be printed, saved as PDFs or sent on WhatsApp.

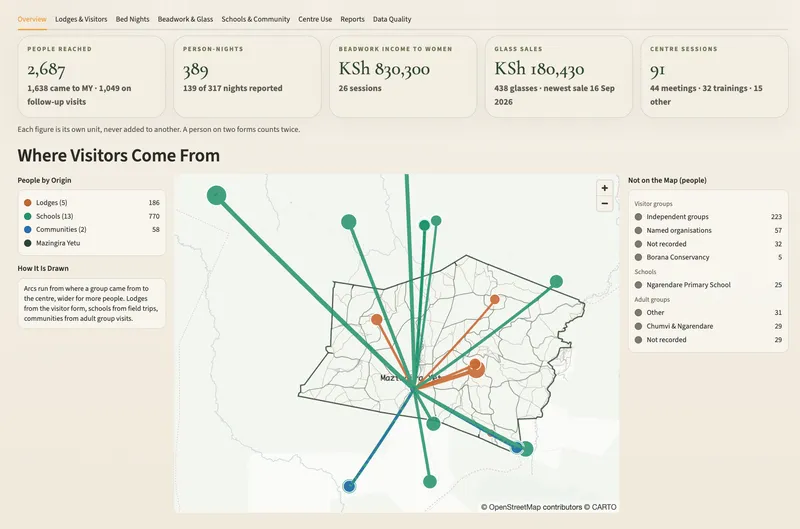
A community programmes dashboard: people reached, person-nights, beadwork income to women, glass sales and centre sessions, above a map of where visiting lodges, schools and communities come from.

Custom systems

Some organisations need a system of their own. We build these on the same platform, around the organisation's own processes: checking patrols against standard operating procedures, for example, or carbon reporting for lodges.

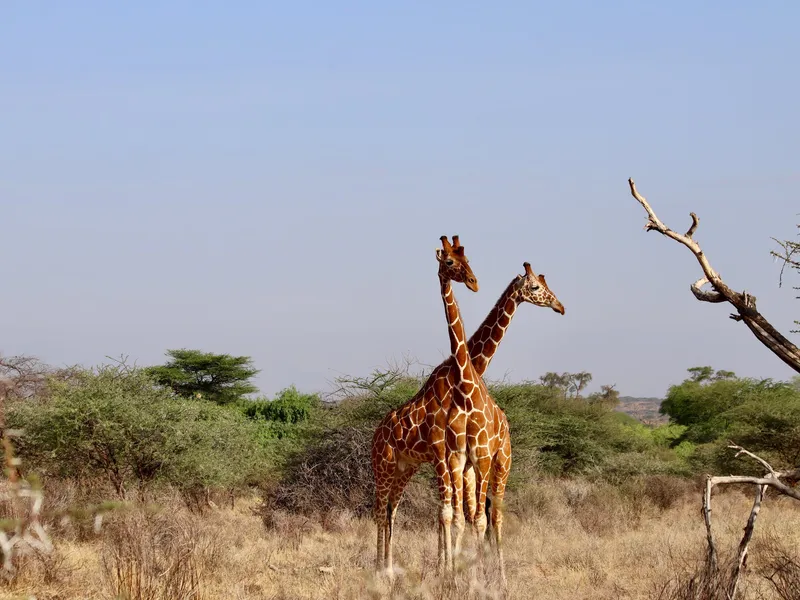
Two giraffes stand together in dry bushland.

Across a landscape

Neighbouring properties on the same standard can be seen side by side: rhinos across boundaries, conflict either side of a fence, rangeland health from one property to the next. Each property decides what it shares.

EarthRanger setup

We set up new EarthRanger sites and bring existing ones into line with a shared data standard, covering forms, lists, alerts, sharing between sites and training. Old forms are kept, along with the records made on them.

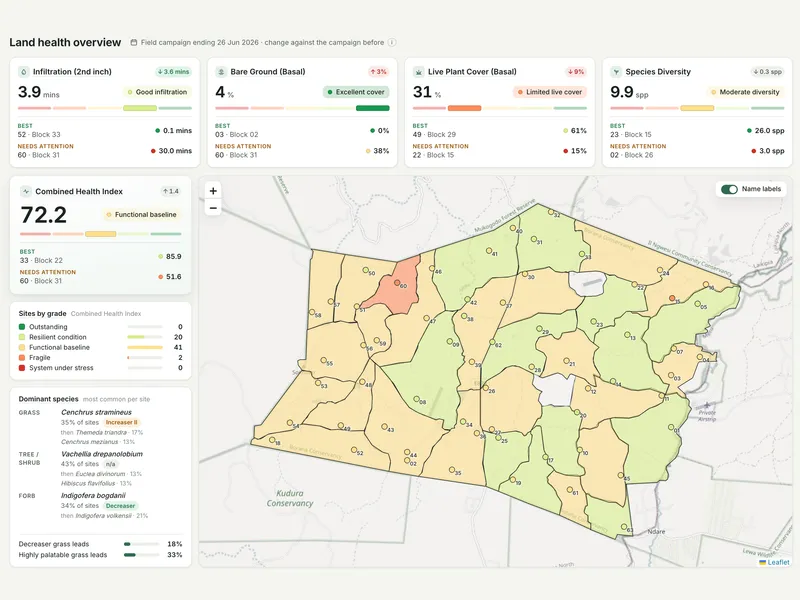
A rangeland health dashboard: scores for water infiltration, bare ground, live plant cover and species diversity, a combined health index, sites by grade and the dominant species, beside a map of the monitoring sites coloured by condition.

Ecological monitoring

We run ecological monitoring in partnership with Catalyse. Rangeland health is measured in the field on a standard protocol: eight tests at each site, covering ground cover, water infiltration, bush cover, soil stability and rooting depth, with fixed-point photographs. A trained team runs the rounds, or we train and equip your own staff and audit a sample of sites. The results are scored from 0 to 100 in five bands, read against rainfall and the livestock records, and delivered as a dashboard and an annual condition report, with the raw data and photographs yours in open formats.

How we work

  1. Review

    We look at your systems and records with you and agree what to build first.

  2. Build

    In stages, one system or programme at a time.

  3. Run

    We host it and keep it running, or set it up in your own cloud account. Your data stays yours.

A mountain rises above a hazy valley and forest.

Start with a review.

We look at your systems and records first, then build in stages and keep it running.